JavaScript Performance: What Actually Works
The cost of the scripts a page ships: downloading, parsing, compiling and executing them.
 Marcus Adeyemi

Where most projects go wrong
The usual mistakes:
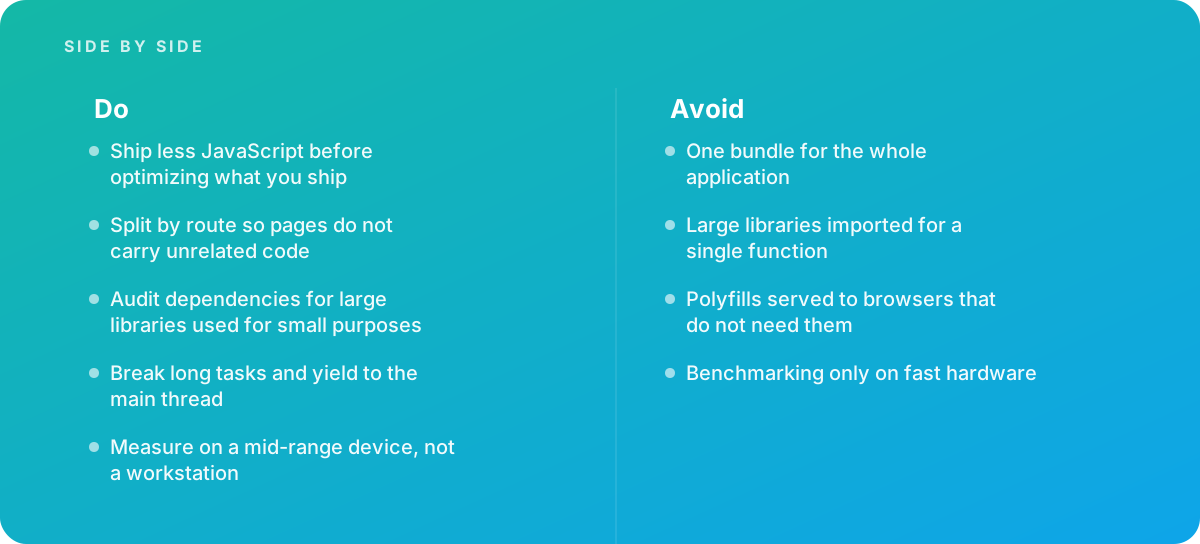
- One bundle for the whole application
- Large libraries imported for a single function
- Polyfills served to browsers that do not need them
- Benchmarking only on fast hardware
What good looks like instead
- Ship less JavaScript before optimizing what you ship
- Split by route so pages do not carry unrelated code
- Audit dependencies for large libraries used for small purposes
- Break long tasks and yield to the main thread
- Measure on a mid-range device, not a workstation
Why it matters
JavaScript is byte for byte the most expensive resource on a page, because unlike an image it has to be parsed and executed as well as downloaded.
The specs that matter
| Measure | Figure |
|---|---|
| Cost | download, parse, compile and execute, on the main thread |
| Device variance | execution cost differs enormously between devices |
| Code splitting | loading only what the current route needs |
| Tree shaking | removing unused exports at build time |
| Long tasks | anything over 50 milliseconds blocks interaction |
Knowing when to hand it over
Tip: Bring in help when bundle size has grown beyond explanation, when INP is failing due to script execution, or when a framework choice is the constraint.
Where this comes from
- web.dev — JavaScript performance
- Chrome for Developers — Main thread and long tasks
- MDN Web Docs — JavaScript modules
The figures and practices above come from the sources listed.
Working on something like this?
We take on Performance & Accessibility work for teams who want it done once, properly. Tell us what you are building and we will tell you honestly whether we are the right studio for it. Start a project.
Where to go next
Spotted something wrong? Report an error on this page. We correct on the page and say what changed.