How to Get Infographics as Content Right
Visual summaries that combine data, illustration and short text to explain a topic.
 Dana Whitfield

At a glance
- Accessibility images of text need text alternatives
- Search text inside images is not indexed as content
- Sources data shown must be cited
- Formats long vertical images are awkward on mobile
Why it matters
Why it matters: Infographics can travel well, but text locked inside an image is invisible to search engines and screen readers.
Best practice
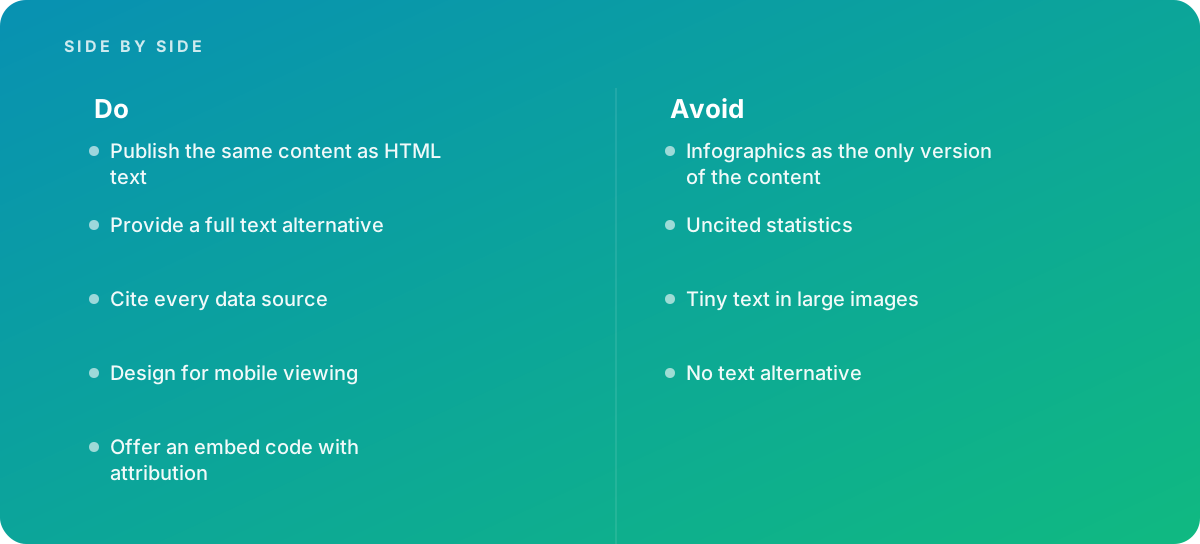
- Publish the same content as HTML text
- Provide a full text alternative
- Cite every data source
- Design for mobile viewing
- Offer an embed code with attribution
Common pitfalls
Watch out for:
- Infographics as the only version of the content
- Uncited statistics
- Tiny text in large images
- No text alternative
When to call in a specialist
Bottom line Bring in help when data visuals support a campaign.
Where this comes from
- W3C Web Accessibility Initiative — Complex images
- Google Search Central — Image SEO best practices
The figures and practices above come from the sources listed.
Working on something like this?
We take on Content Strategy work for teams who want it done once, properly. Tell us what you are building and we will tell you honestly whether we are the right studio for it. Start a project.
Where to go next
Spotted something wrong? Report an error on this page. We correct on the page and say what changed.