A Practical Guide to Scientific and Molecular Visualization
3D visuals of molecules, cells and physical systems for research communication and education.
 Imogen Clarke

Why does it matter?
These visuals communicate research to non-specialists, and they must stay faithful to the underlying data.
What are the numbers?
- Structural data molecular structures come from published data sets
- Abstraction visual conventions simplify complex structures
- Scale molecular scale is difficult to convey intuitively
- Review researchers should verify depictions
What should I do?
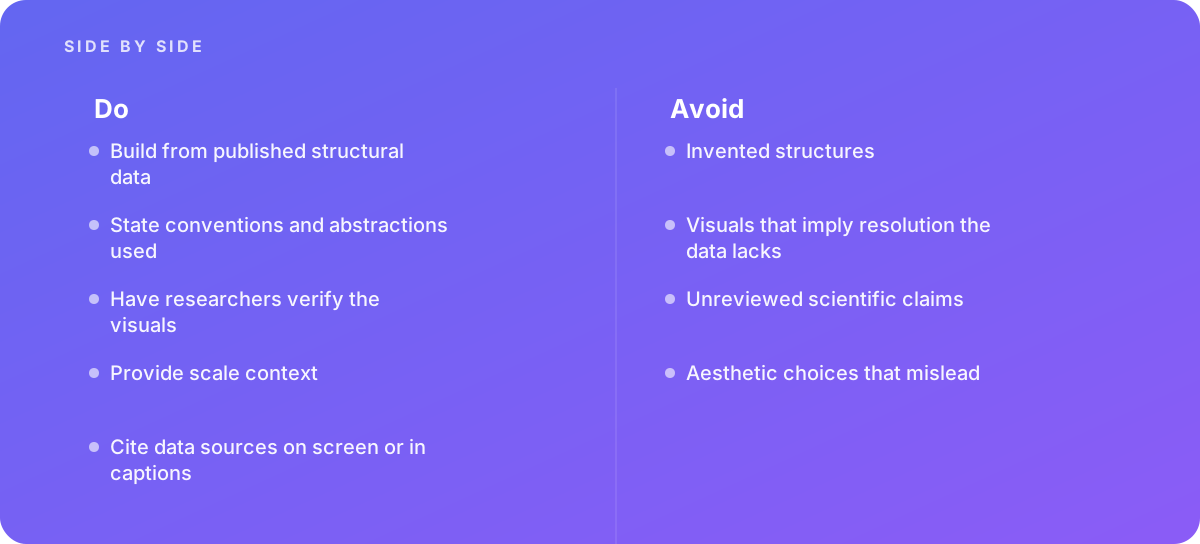
- Build from published structural data
- State conventions and abstractions used
- Have researchers verify the visuals
- Provide scale context
- Cite data sources on screen or in captions
What should I avoid?
Avoid:
- Invented structures
- Visuals that imply resolution the data lacks
- Unreviewed scientific claims
- Aesthetic choices that mislead
When should I get help?
Short answer Bring in help when communicating research visually.
Where this comes from
- Pew Research Center — Methods
- Blender Foundation — Blender Manual: Modeling
The figures and practices above come from the sources listed.
Working on something like this?
We take on 3D Design & Development work for teams who want it done once, properly. Tell us what you are building and we will tell you honestly whether we are the right studio for it. Start a project.
Where to go next
Spotted something wrong? Report an error on this page. We correct on the page and say what changed.