Statistical Significance in A/B Tests: The Decisions That Matter
The statistics behind deciding whether a test result is real or just random variation, including sample size and confidence.
 Samir Haddad

What is at stake
Most failed experimentation programs call winners too early, then wonder why the lift never appears in revenue.
The playbook
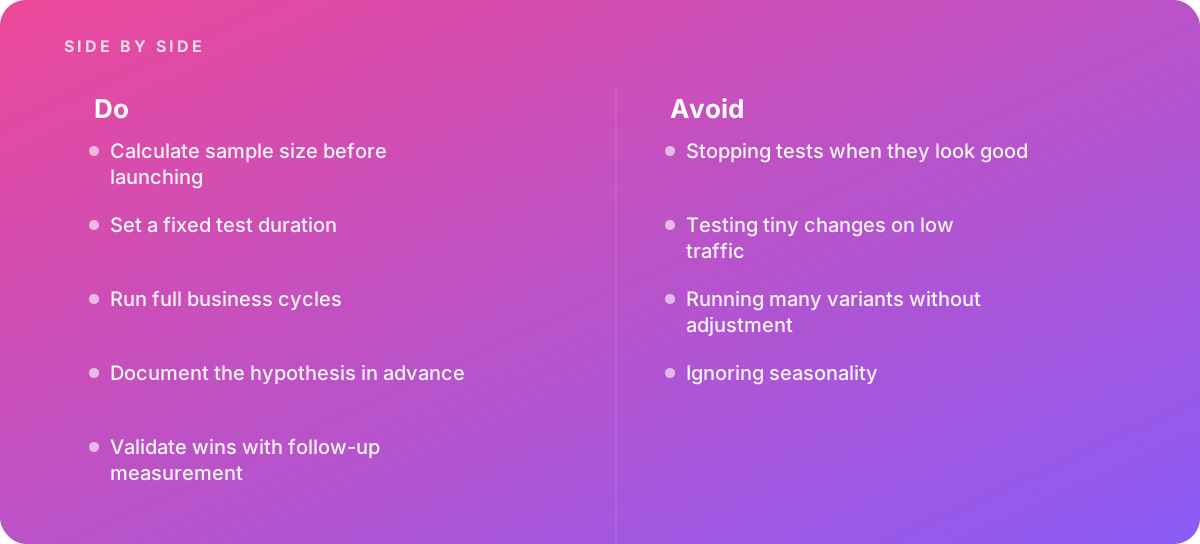
- Calculate sample size before launching
- Set a fixed test duration
- Run full business cycles
- Document the hypothesis in advance
- Validate wins with follow-up measurement
Where it goes wrong
Avoid:
- Stopping tests when they look good
- Testing tiny changes on low traffic
- Running many variants without adjustment
- Ignoring seasonality
The numbers behind it
| Measure | Figure |
|---|---|
| Sample size | needs to be calculated before a test starts |
| Peeking | checking results repeatedly increases false positives |
| Confidence | a 95 percent confidence level still allows false positives |
| Minimum detectable effect | small effects need much larger samples |
Getting outside help
When to hand it over: Bring in help when test results do not translate into revenue.
Where this comes from
- Nielsen Norman Group — A/B testing
- National Institute of Standards and Technology — Engineering Statistics Handbook
The figures and practices above come from the sources listed.
Working on something like this?
We take on Digital Marketing & CRO work for teams who want it done once, properly. Tell us what you are building and we will tell you honestly whether we are the right studio for it. Start a project.
Where to go next
Spotted something wrong? Report an error on this page. We correct on the page and say what changed.